Compare Health Insurance Costs During Open Enrollment
Compare health plans using total cost and risk, not just premiums, during open enrollment decisions.
What to Evaluate When You Compare Health Insurance Costs During Open Enrollment

If you take finances seriously, open enrollment is not an annual form.
It is a financial risk allocation decision.
According to the Kaiser Family Foundation (KFF, Employer Health Benefits Survey 2025), the average cost of employer-sponsored plans exceeds $8,000 per year for individual coverage.
For families, it can exceed $25,000 annually. This places healthcare among the largest recurring costs for American households.
In practical terms: you are not choosing a plan.
You are pricing annual medical risk.
The real context: healthcare as a financial risk system
According to the Centers for Medicare & Medicaid Services (CMS, National Health Expenditure Data):
- U.S. healthcare spending continues growing at roughly 5% to 7% per year
- The system is progressively shifting more direct costs to the consumer
This means the structure is moving from collective risk to individual risk.
The structural mistake in plan comparison
Most people compare like this:
“What has the lowest premium?”
But according to the KFF Marketplace Analysis, the premium is only part of the total annual cost.
The correct model is:
Total Cost of Coverage (TCC), or risk-adjusted total cost.
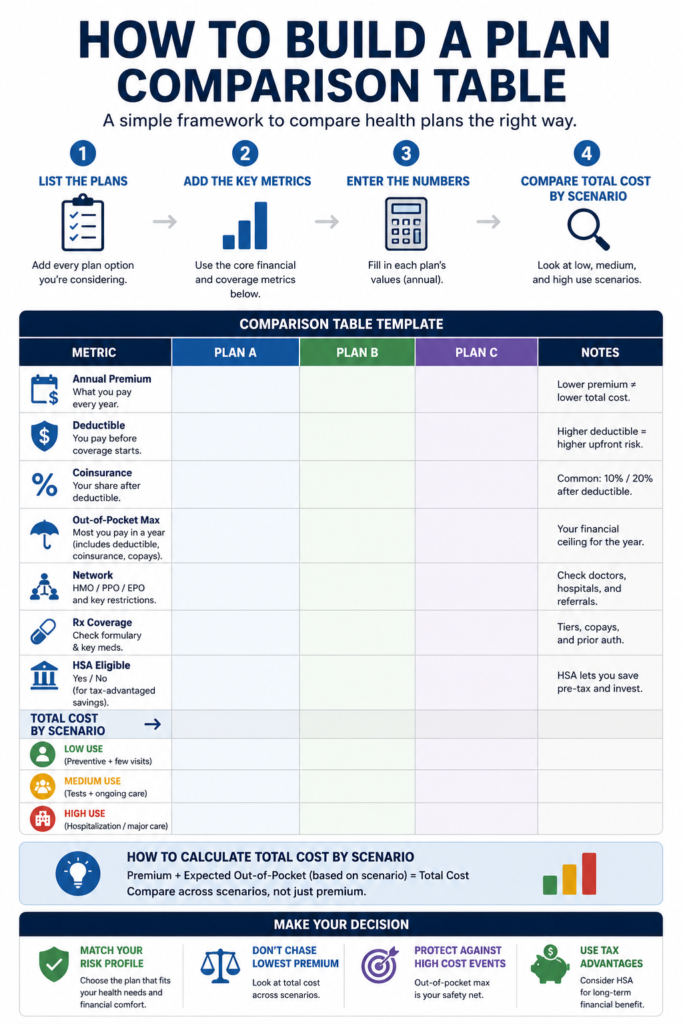
Real financial components (official definitions)
According to Healthcare.gov (CMS):
| Component | Definition | Financial role |
|---|---|---|
| Premium | fixed monthly payment | predictable cost |
| Deductible | amount paid before coverage activates | initial risk |
| Coinsurance | % paid after deductible | variable risk |
| Out-of-pocket max | annual legal cap | maximum protection |
The Out-of-Pocket Maximum is the regulatory limit of annual patient exposure (defined under the Affordable Care Act via CMS).
Decision scenarios
Correct analysis requires simulating usage scenarios.
According to risk methodology used in health economics (CMS & actuarial frameworks):
| Scenario | Medical usage | Financial driver |
|---|---|---|
| Low | minimal visits | premium |
| Medium | exams + consultations | deductible |
| High | hospitalization or illness | out-of-pocket max |
Practical cost structure example
Consider two structured plans:
| Metric | Plan A | Plan B |
|---|---|---|
| Annual premium | $3,600 | $7,200 |
| Deductible | $4,000 | $1,000 |
| Out-of-pocket max | $8,000 | $5,000 |
According to actuarial logic used in CMS guidelines:
- Plan A optimizes low-usage scenarios
- Plan B reduces tail risk (medical catastrophe exposure)
There is no “better plan,” only different risk distributions.
The most ignored factor: extreme risk
According to the Agency for Healthcare Research and Quality (AHRQ):
- Hospital events can generate costs ranging from thousands to tens of thousands of dollars per episode
- A small number of events accounts for a large share of total annual spending
This confirms a core actuarial principle: insurance exists to cover low-probability, high-impact events.
Plan types
According to the U.S. Department of Health & Human Services (HHS / Healthcare.gov):
| Type | Structure | Ideal use |
|---|---|---|
| HMO | closed network | lower cost, less flexibility |
| PPO | broad network | more flexibility |
| HDHP | high deductible | compatible with HSA |
Financial strategy: HDHP + HSA
According to the IRS (Internal Revenue Service Publication 969), Health Savings Accounts (HSA) provide:
- Pre-tax contributions
- Tax-free growth
- Tax-free withdrawals for qualified medical expenses
In financial terms: an HSA functions as a hybrid between insurance and investment.
Real tax impact
According to the IRS tax structure (2025 brackets):
- HSA contributions reduce taxable income
- Effective savings can reach 20%–37% depending on tax bracket
Simplified example:
| Item | Nominal value | Adjusted cost |
|---|---|---|
| HSA $3,000 | $3,000 | ~$1,800–$2,400 (depending on bracket) |
Advanced model: Expected Cost Framework
This aligns with actuarial practices used in healthcare risk analysis (CMS actuarial modeling):
Expected Cost =
(probability of low scenario × low cost) +
(probability of medium scenario × medium cost) +
(probability of high scenario × high cost)
This replaces decisions based only on premiums.
Checklist based on official sources
During open enrollment, evaluate:
- Annual premium (CMS marketplace data)
- Deductible
- Out-of-pocket maximum (ACA legal limit)
- Coverage network (HHS definitions)
- Covered medications (regulated formularies)
- HSA eligibility (IRS Publication 969)
- Employer contribution (KFF employer survey metric)
- Total tax impact (IRS tax brackets)
Common mistakes
- Focusing only on premium
- Ignoring out-of-pocket maximum
- Not considering subsidies or employer contributions
- Not modeling high-cost scenarios
- Ignoring tax impact
Here is the cleaned-up version without caps:
Professional step-by-step guide – open enrollment
Gather all real plan data (no opinions)
You don’t start by choosing. You start by collecting data.
For each plan, get:
- Monthly and annual premium
- Deductible
- Coinsurance (%)
- Out-of-pocket maximum (annual limit)
- Copays (doctor visits, exams, emergency care)
- Medication list (formulary)
- Provider network (in-network coverage)
Useful tools:
- Your employer’s benefits portal
- Healthcare.gov plan comparison (if applicable)
- Summary of benefits and coverage (sbc) pdf
Define your real medical usage profile
Without this, you are guessing.
Classify yourself (or your family) into 3 scenarios:
- Low usage: occasional visits, no chronic conditions
- Medium usage: regular checkups and exams
- High usage: chronic condition, surgery, pregnancy, high risk
For better accuracy, use your last 12–24 months of medical history.
Model the total annual cost of each plan
This is where most people make mistakes.
You don’t compare premiums. You calculate:
total cost = annual premium + expected medical expenses
Do this for each scenario:
- Low usage
- Medium usage
- High usage (catastrophic scenario)
Tools:
- Excel or google sheets (essential here)
- Simple sum and scenario formulas
Simulate the “real worst case” (extreme risk)
This is ignored by 90% of people — and it’s the most expensive mistake.
Key question:
“if everything goes wrong this year, how much do i pay at most?”
The correct answer comes from:
- Out-of-pocket maximum
This defines your real annual financial risk ceiling.
Compare not only cost, but risk distribution
Now evaluate two dimensions:
Cost efficiency (average scenario)
which plan is cheapest on average?
Catastrophic protection (high-cost scenario)
which plan protects you better in the worst case?
Adjust for tax benefits (hsa if available)
If you have an HDHP + HSA:
Include in your calculation:
- Annual hsa contribution
- Tax savings (20%–37%)
- Medical spending paid via hsa (pre-tax)
Tools:
- HSA calculators (fidelity, optum, lively)
- IRS publication 969 (official reference)
Include employer contributions (hidden money)
Many people ignore this and make wrong decisions.
Check for:
- Employer hsa contributions
- Premium subsidies
- Matching contributions (if any)
Tools:
- KFF employer benefits benchmarks
- HR benefits summary
Run a financial stress scenario
Create 3 final lines for each plan:
- Low scenario → total cost
- Medium scenario → total cost
- High scenario → total cost (catastrophic case)
Now you see the plan as a risk portfolio, not a subscription.
Choose based on 2 objective criteria
Professional decision = balance between:
- Lowest expected cost (ev)
- Acceptable worst-case exposure
There is no universal “best plan”.
There is:
- Cost-optimized plan
- Safety-optimized plan
- Hybrid plan
Professional tools recommended
Spreadsheets (essential)
- Google Sheets (simple and sufficient)
- Excel (better for advanced modeling)
Simulation and analysis
- Excel what-if analysis
- Google Sheets scenario formulas
- Python (for advanced simulation models)
Reliable data sources
- CMS (centers for medicare & medicaid services)
- Healthcare.gov plan data
- KFF (Kaiser Family Foundation reports)
- IRS publication 969 (HSA rules)
Ready-made calculators
- HSA calculators (fidelity, optum, lively)
- Employer benefits calculators (hr portals)
Save this for yourself
Keep this image in your gallery and make better plan choices!
FAQ — Health Plan Comparison (Open Enrollment)

Related content
Build a Tax Refund Plan Before the Money Arrives
Build a smart tax refund plan before it arrives. Pay off debt, invest strategically, and strengthen your financial future in the U.S.
Keep reading * You will remain on the current website